Mobile World Congress 2022

The Netradar Team had the privilege to participate to MWC 2022 in Barcelona. 1133 exhibitors compared to 2500 of three years ago.

Jukka Hieta Netradar Sales Director demo the Netradar Dashboard at Mobile World Congress 2022

The only big company that cancelled its participation was Sony Corp. while many companies including us were really looking forward to meeting both existing customers and new prospects finally, live, face-to-face after COVID closure with great enthusiasm.


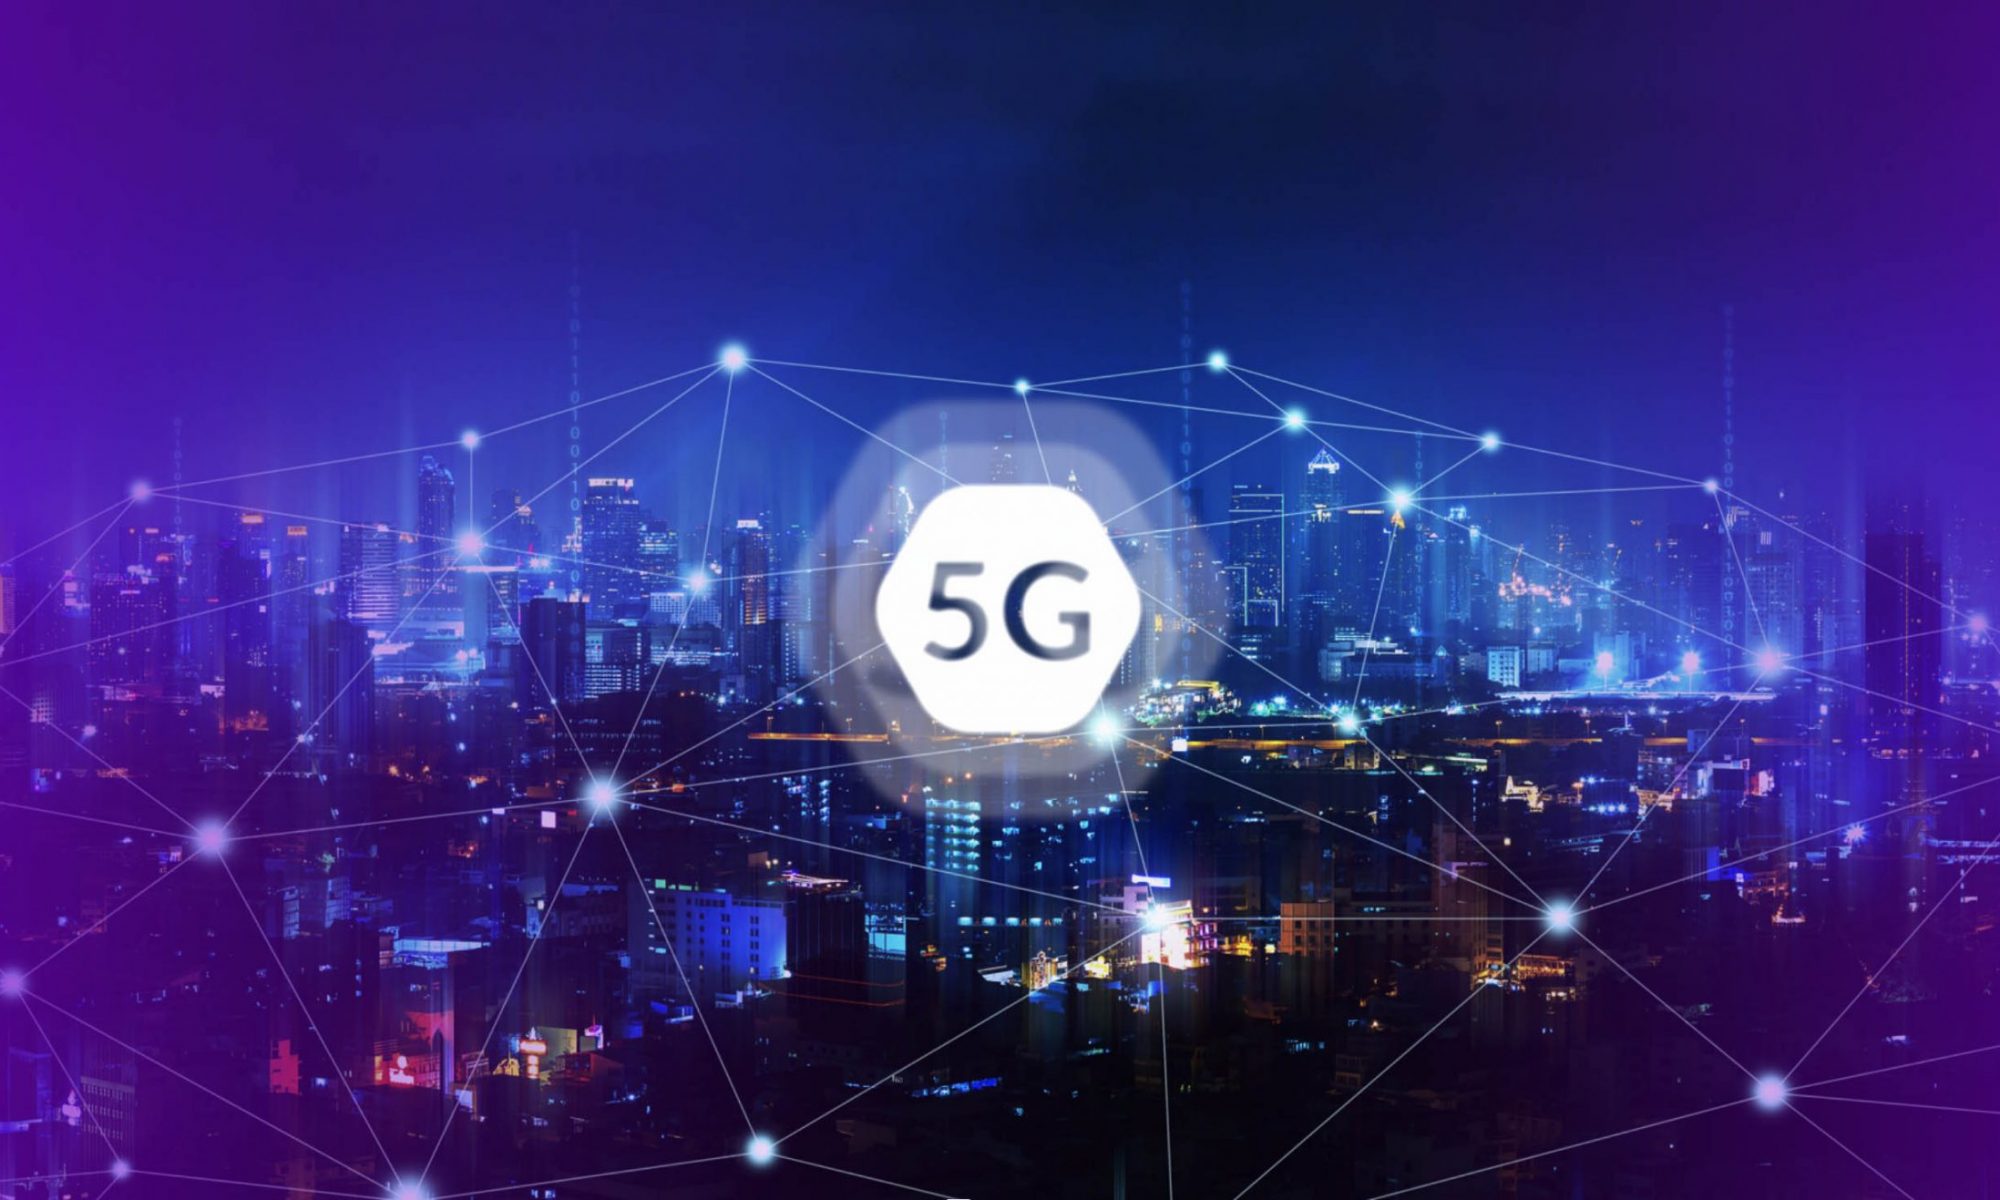
The most common themes among operators were sustainability, open RAN (open radio access network), increasing role of Private Mobile Networks and network slicing.


Key findings from two recent surveys by the Economist and Capgemini show that 51% of companies plan to deploy a private 5G network within the next 6–24 months and 80% of surveyed executives agree that COVID-19 has made it easier to secure the budget needed for 5G.


As integration with legacy systems and infrastructure complexity are the key barriers for implementing 5G, a solution that can show how wireless network end-users perceive the network service is essential. Furthermore 35% of industrial organizations prefer to deploy fully private 5G networks.


Furthermore, the number of meetings we had, clearly shows how important network analytics is to mobile operators and ISPs. We had several unscheduled meetings where the service provider had looked us up beforehand and came to our meeting room with clear idea how our Netradar wireless network analytics solution can help them.


One of the highlights was definitely the visit of Timo Harakka, Transport and Communications Minister of Finland together with Sari Rautio, Ambassador of Finland in Spain.

From the left Jukka Hieta Netradar Sales Director, Timo Harakka, Transport and Communications Minister of Finland, Tomi Paatsila Netradar Founder & CEO together with Sari Rautio, Ambassador of Finland in Spain.

Looking forward to continuing the great discussions we had at #MWC2022.

Don’t forget to email jukka.hieta@netradar.com if you want to talk about our solution for mobile performance network monitoring.

Missing coverage? Spot the network black spots with Netradar

Mobile coverage is estimated with simulations and planning tools. These work quite well and give a decent estimate for the basis of deploying a wireless network. Once deployed, a lot of testing needs to be done to verify the outcome.
Yet, the world we live in is not always as easily modelled as we might think. Radio signals propagate in ways that might be quite different from the plans. The tilt and direction of the antennas in the tower have a direct relationship with the service the customers receive.
Outdoors the landscape and buildings affect the effective coverage. For indoors, the size of the building, the construction materials and the location of the user within the building (e.g. deep inside the building or in a basement) impact how well the signal is received by a mobile device.
In this article, we discuss these challenges, and how Netradar can solve these issues.

Any coverage missing

In Hollywood movies, we can sometimes see a scene where a person needs to make a call for help but the mobile phone simply says “No signal” or the like. In real life this should not happen that often, but it still does.
The Netradar SDK (SW component of just 400KB) has a feature to detect when the mobile phone does not have any cellular signal. The SDK then stores information about this location and pushes the data to the backend. We can also include data about other providers in the area that did have a signal available if the SIM operator did not. This allows gathering real data about black spots in your network and fixing issues before they also create a Hollywood moment.

4G missing

According to the latest Cisco Annual Internet Report, 4G coverage is today the dominant cellular technology. 3G comes second and 5G will slowly grow its role. Thus, for many years to come, people will rely on 4G to meet their daily needs and feed the traffic to their apps.
4G coverage is estimated with planning tools and verified in the field as much as possible. The final judge will be those customers whose mobile phones then try to connect to 4G, if available. In developed countries, 4G should cover all major cities, towns and highways. Yet, often when moving in rural areas, 3G is the fastest technology available.
Netradar collects the radio details periodically and when people use the data connection. We build coverage maps to show where 3G is the dominant radio technology and where 4G rules. This data can be compared automatically with the maps generated by planning tools to see where the simulations failed and 4G coverage is not available in reality.
Yet, connecting to 4G does not necessarily mean a high speed connection. We all know that radio signal quality gives an upper bound to the possible bit rate available to the customer, but not the lower bound. Network capacity can run out and lead to very bad effective speeds. Yet, we must remember that simply seeing a low speed on a device does not mean the network is at fault; the low speed can also be caused by the content servers themselves. This is an absolutely critical differentiating factor in how Netradar can analyze the data connectivity compared to any other solution on the market. In addition to the availability and quality of the radio signal, we also analyze the effective capacity and how well it meets the customers’ needs.

5G missing

The new 5G service is being deployed in many markets. The benefits of 5G to the consumers are best seen in the increased capacity. Mobile devices very rarely need high top speeds, often around 10Mbps is enough. However, with increased usage comes capacity shortage, and this is where 5G can make an impact.
With 5G NSA, the 4G network provides the signaling and 5G carries the data. With Netradar, we can identify where the 4G control signal is available and where people actually get the 5G bearer activated. We collect radio quality metrics for the 4G signaling and the 5G data bearer.
With 5G SA, we naturally get the full 5G picture as 4G is not needed anymore. We offer the 5G signaling coverage and the radio details when data is transmitted over that radio.
As 5G is still an emerging technology and we learn how the high frequency band works in real situations, there can be locations with a very bad effective capacity. Sometimes simple configuration mistakes can create quality issues. Netradar always analyzes the quality of the data connection in terms of speed and network capacity. We show all cases where the customer got a low network performance, to help the radio team to fix the network based on real customer data.
In summary, Netradar provides a huge amount of data and a set of different analytics to help operators build a real competitive advantage and enhance their network together with their customers. We can pinpoint totally missing coverage (Hollywood style), missing 4G or 5G, and even low capacity as experienced by the real users of the mobile network.
If you have come this far, I’ll give you a short heads up on a forthcoming feature of Netradar. Crowd-sourced data is typically submitted and analyzed on a daily or weekly basis. We are bringing to the market, to the best of our knowledge, an almost real-time network coverage and capacity warning system. If mobile devices carrying our SDK record a network issue, like missing coverage or very bad capacity, they can report those immediately to the backend and you, responsible for network performance, can fix the issue in almost real time, shortening the response time it takes to fix potential emerging issues.

Analyzing 5G coverage and service quality

The current 5G service is built on the existing 4G core and 4G signaling, the so-called Non-Standalone Mode (NSA). The signaling and data transmission are asymmetric in that they are run on different frequencies. The 5G data bearer uses in most cases the 3.5GHz frequency band while the 4G signaling channel uses lower frequencies.
In theory everything works well and the 5G subscribers always get a 5G service when they are in the planned coverage area. In most cases this probably is so, but there are many situations where the planned and effective 5G service differ. A customer who has a high-end 5G phone with an expensive 5G data plan will not be happy.
The network operations center has a huge amount of information on the performance of the network, from very low level details from the cell sites to high level KPIs. Yet, they do not see what the customer experiences, where and when.
In the following, we show some examples how Netradar data can be used to build the best possible 5G service.​​

Signal coverage of 5G

Your network planning tools give one estimate of where the 5G bearer should be strong enough to carry data. Yet, as the most common frequency in 5G is 3.5GHz, it will propagate differently, e.g. it has a shorter effective range than earlier used frequencies and does not penetrate buildings as well.
In particular the indoor coverage may be very challenging to measure and locate the places that need better planning.​

• Coverage of 4G signaling in 5G NSA​

In a 5G NSA service, the 4G network offers the control signaling to the devices. The availability of 5G is advertised inside the 4G channel parameters. In an optimal case, the 5G is advertised in the same area the new radio is really available. Often the same base station offers the 4G signaling and the 5G bearer.

With the Netradar analytics, we can see where the 5G service is being advertised by the 4G signal.​

• Difference between signaling and data bearer​

As the frequencies are different and the propagation of the 4G and 5G signals are estimated based on models, we have situations where the network advertises a service that is not available in real life.

The Netradar analytics sees where 5G is being advertised by the 4G network and where people with 5G devices and subscriptions really do get onboard 5G. Digging further into the data, we can help understand why the customer does not get the new service and is instead left on 4G.

• Handovers between 4G and 5G​

When both 4G and 5G are available, the network controls the service the customer gets. The decision on which radio service to choose is taken by the network. In most cases this works great. But with Netradar analytics, we can see situations where the customer’s device jumps back and forth between these two radio technologies. This increases delays in the data transmission and even full service loss before the new bearer is configured to carry the customer’s data.​

Performance​

The new 5G service offers a higher peak bit rate and lower latency compared to 4G – at least in most cases. Yet, as the 5G service is run along 4G and the data bearer is running on a different frequency, there can be serious performance issues that affect the customer. ​

In general, 5G offers a lower latency. The industry talks about 1ms latency but this usually means the delay of the radio link, not an end-to-end delay to the content in the cloud. The 1ms delay could be possible if content is hosted in the base station itself, so-called edge computing.​

In reality, we see a similar end-to-end latency with current 4G and 5G networks. 5G latencies tend to be a bit smaller but since the path to the content can be long, the benefits of a lower latency radio link diminish.​

Yet, what we do see in our data, is that 5G users often have very high latency peaks in their data transfers. With 4G, the worst case latencies can be several hundred milliseconds in a congested network but with 5G we have seen latencies as high as 1.5 seconds in some networks. These indicate that something in those 5G networks is not working right.​

Similar surprises we see also with 5G download speeds. The industry advocates 1 Gbit/s peak speeds, and sometimes consumers can get very high speeds. But we also see very low speeds in 5G, even lower than 4G offers in the same location. In these cases, the device was using a very bad 5G bearer even though a better 4G signal would have been available. We also see network congestion events in 5G that lead to download speeds of less than 10 Mbit/s – not a tremendous service for a premium subscription.​

The above are only some examples of analytics and views we can offer to a 5G provider. In a future post, we will look in more detail in these cases with real data from mobile networks. Stay tuned!​

Remote working and indoor coverage: why MNOs need to pay attention

Exactly how many workers will work outside of the traditional office setting is hard to predict, but we are undoubtedly looking at a significant shift. In turn, workers are now much more reliant on connectivity outside the office environment to get their job done.​

recent EU policy brief suggested that home and remote working across the EU-27 was at 5.4% of employed persons in 2019. The report proceeded to point to early estimates that found that, in 2020, the percentage rapidly shot up to 40%. Overall, the report suggested the “teleworkable” proportion of workers is around 25%.

Exactly how many workers will work outside of the traditional office setting is hard to predict, but we are undoubtedly looking at a significant shift. In turn, workers are now much more reliant on connectivity outside the office environment to get their job done.​

While working at home or in public indoor spaces such as coffee stores users will also often rely on their cellular provider to be productive and to stay connected – and that matters for MNOs.​

Indoor mobile performance is gaining importance over Wi-Fi​

From the perspective of MNOs, a shift to remote working may at first glance not matter that much – after all, one could reasonably assume that most of these workers will rely on Wi-Fi linked to a fixed-line connection. The reality is a bit more complicated and that has implications on how indoor coverage matters for your customers.

Thanks to today’s uncapped data plans more users are tempted to ditch fixed-line connections to rely only on their mobile provider for data. A recent Tefficient report hints at this as Finland – a market where unlimited data plans are increasingly commonplace – shows incredibly high data use.

One operator – DNA – logged on average 34.8GB of data usage, per SIM, per month. That is the second highest of all the operators in the survey. Finland’s two other operators are also near the top.​

There are a few other scenarios worth considering. Your users may not work remotely from the same location every time, trying a new coffee store, for example. Users would therefore be reliant on your indoor coverage more often than expected, and in different locations. ​

What does it mean for MNOs?​

Given the shifts to remote working and uncapped mobile plans more and more of your users may be relying on your network for everyday internet access, including the ability to get work done. Users will likely have an alternative option should mobile coverage fail but switching to a failover doesn’t make for a happy user.​

As the mobile operator, you need to be aware of user expectations and user sentiment. Accessing work networks and staying productive is an issue that can quickly become emotive. It is not hard to see how frustrated a user may get if they are unable to complete work or access an online work environment because your network’s indoor coverage is letting them down. ​

It’s all down to the user experience after all. We’ve all been in online meetings where half the participants cannot hear each other. More often than not the discussion ends up unbalanced as some contribute more than others – and other participants are left frustrated because they were out of the loop.​

Again, while users could plan for this eventuality, they may well not do so – and simply blame the poor performance of your network for their poor experience. For that reason, MNOs must pay attention to the user experience indoors. ​

Besides, from an IT procurement perspective, why would C-level execs invest in unlimited data plans for employees if it does not allow them to work remotely? MNOs risk that companies will conclude that fixed lines are still the safer alternative.​

Getting indoor coverage right​

Measuring and monitoring indoor performance should be your first port of call – it provides you with the insight to address poor indoor performance.​

However, measuring indoor performance is particularly complicated because “indoor” as a location is not a Boolean value; there is no simple “yes” or “no” as to whether the user is indoors. Rather, we see the notion of indoor and outdoor on a sliding scale in terms of “how far indoors” the user is. ​

The user might be simply in the living room next to large windows, in which case they could have a good mobile signal. Or, the user could well be further inside a building, in an inner yard surrounded by tall buildings, a basement, or high up in a skyscraper. Thus, for proper indoor coverage planning, we need to understand how far the user’s location is from clear skies and from the outside environment where radio coverage typically is at its best.​

At Netradar we have extensive experience in helping MNOs boost indoor coverage – backed by our powerful crowdsourced analytics tools which mirror the real user experience. For example, our indoor analytics tool can automatically map data session performance into one of five zones on an indoor, outdoor scale. It allows operators to rapidly assess the user experience in a given location. Indeed, the Netradar anomaly detector can automatically identify the top 50 indoor locations with poor and missing indoor coverage.​

With Netradar’s data, MNOs can pinpoint indoor performance issues to a very fine level – including specific buildings, and specific floors in buildings. It allows MNOs to understand where and when home workers are experiencing poor network performance – and to target these issues for remediation.​

What can network operators do with this data? Granular network performance data allows MNOs to tweak networks very finely for maximum coverage – while doing so in a cost-effective manner. ​

Yes, 5G is complicating matters, particularly where short-range mmWave frequencies are used, but accurate data can help operators plan network tweaks such as rolling out distributed antenna systems (DAS) or small cell solutions. Tweaks in terms of antenna locations and direction may also help – all based on real, on-the-ground performance data as reported by users.

Of course, other alternatives include indoor boosters and Wi-Fi calling – but though effective, these tools are a last resort as the associated user experience just isn’t ideal.

Netradar – key to monitoring indoor network performance​

Indoor coverage is not just about home working. MNOs will also serve business premises better by monitoring indoor coverage – particularly given the growing prevalence of IoT, Industry 4.0, and other enterprise mobile applications.​

With more and more business users now relying on your network for indoor coverage, a consistent user experience is more important than ever. Netradar’s analytics provides a powerful tool to help MNOs monitor indoor performance, allowing your network to alleviate indoor performance problems before users get frustrated.​

The Netradar indoor monitoring capability delivers a simple operational workflow. MNOs simply use the anomaly detector to identify the indoor locations with the worst performance, feeding the results into a work log. Optionally, measurement teams can be sent to the identified locations to take real-life measurements.​

Next, the operator plans and implements fixes to poor indoor performance. As a final step, the operator goes back to Netradar to verify that the problem has been resolved – and verifies this against network statistics.​

Indoor network performance matters​

Indoor is critical, not only for remote workers but also for businesses, like shopping malls, arenas and the like. And the more we move to 5G and higher frequencies, the more the indoor signal coverage becomes more challenging. ​

Moreover, many governments are moving towards mobile cellular networks to run the communications of first responders and safety personnel, and they need perfect coverage anywhere and everywhere, otherwise lives may be at risk. ​

In short, indoor coverage really matters – and Netradar’s unique indoor performance toolset is positioned to help MNO’s maximise indoor performance.​

How to measure real latency, as experienced by your customers?

Latency has become a hot topic with the introduction of 5G. When advocating 5G services, the industry talks about gigabit download speeds and about 1ms latency in 5G (but forgets to mention that this is the radio link latency, not to the content, but more about that later). ​

A low latency is truly beneficial for some daily mobile applications, like VoIP calls and real-time multiplayer gaming. If the visions of self-driving cars running over 5G becomes reality, a low latency surely is important there, too.​

So, what is the latency that your customers are truly experiencing in their daily usage of the mobile network?​

It is fundamental to note that “latency” can be used to describe different metrics. It can be either the one-way latency between two points, or the two-way latency or Round Trip Time (RTT). ​

The one-way latency is challenging to calculate accurately as it requires the clocks to be synchronized between the measuring nodes. One could also simply measure the RTT and divide it by two to get a rough estimate of the one-way latency. Yet, in asymmetric networks, which mobile networks are, this would be inaccurate. The RTT (or what people often refer to as “ping”) is much easier to measure, as the sending and receiving timestamps are taken from the same physical clock.​

Components of the latency that affect the consumers’ apps is the sum of many factors:

1. Radio link

2. Access network​

3. Core network

4. Content server​

The radio link (1) and access network (2) are the key components that eventually define most of the latency. The radio link, in particular, is the part that often becomes congested, increasing the latency of the mobile applications data flow.​

Core networks (3) do not easily get congested, unless some hardware or cables do break. The RTT introduced by a fiber core is roughly 1ms/1000km but the hardware used increases this further, to a range of 1.5-3ms/1000km. ​

Content servers (4), residing in a data center, can be a bottleneck if the service is run on inadequate hardware not up to the task of serving the current user base. The hardware can introduce latency in the server nodes themselves, the internal data center network or the external internet connection.​

How should you measure latency? ​

If we focus on crowdsourced measurement methodologies, we notice that most players have a look-up system that seeks to allocate the nearest measurement node for the test. The more nodes you have, the better the chances are that the end point is physically close to the measuring device and the lower reported latency. ​

Often with latency, one can measure the jitter, a notion of how stable the latency is and a way to show how much fluctuation there is. The closer the content is to the end user, the lower the jitter is, too.​

Yet, as most players measure latency before a synthetic speed measurement, the reported latency and jitter present optimal results in an unloaded network. ​

Our daily apps do not operate in empty environments. Our apps send and receive data all the time, some more, and some less, and depending on the other users in the network, the capacity available changes. As the available capacity of the radio network drops, the user data starts to get buffered before transmission and latency grows.​

Netradar measures latency inside the ongoing users’ data transfers. We use sophisticated AI (artificial intelligence) algorithms to decide when and how to measure the latency. ​

Our analytics can therefore present the real latencies experienced by the end users, while using their daily mobile apps.​

Furthermore, at the heart of Netradar is our algorithms that can identify network congestion and show user data transfers that were limited by the mobile network. By combining our latency measurements with the congestion detection algorithms, and the detailed contextual data, Netradar can provide a very detailed picture of the performance of a mobile network, from a country to city level, down to individual routing areas, base stations and even antenna sectors.​

What does Netradar analytics show ?​

Our analytics, in relation to latency, show the familiar metrics that most crowdsourced systems or dedicated measurement hardware can show and a lot more. As we know when the network is running perfectly, and when there is a shortage of capacity, we can analyze the configurations of different parts of the network and help optimize the performance and the behavior.​

The Netradar analytics show, in terms of latency:

1. Average latency as consumers and their apps experience the mobile network in their daily journey, regardless of the network capacity; ​

2. Minimum latency, the optimal case, when everything works perfectly (similar to the typical latencies reported by speed tests);​

3. Maximum latency, the worst case, when the network is seriously overloaded;​

4. Latency when there is ample capacity to server the users; ​

5. Latency in a congested network; ​

6. Latencies caused by handovers between base stations or radio technologies;​

7. All of the above can be applied to radio technologies: 3G, 4G and 5G (SA and NSA), as well as ​

8. To any number of reference points that enable a very extensive view of data connectivity, even international network peering. ​

In Netradar, latency is not a simple single value, rather a multi-dimensional metric that can be used to study in detail your own network, and the ones of your competitors. ​

To deploy Netradar ​

Netradar is a solution for collecting private network performance analytics. As such, our customers have the ability to deploy measurement points anywhere on the planet. We can rotate the location to test latency between different national hot-spots, data centers or even access network hubs. We can also measure around the world, to see latency to different countries, or to major cloud providers like Amazon, Google and Microsoft. ​

Our latency measurement servers are designed to be extremely lightweight, yet powerful. A single server running in a virtual machine can serve tens of thousands of customers. This is yet another benefit from our architecture and methodology: you do not need to deploy heavy servers for testing top speeds, only lightweight “ping” servers. ​

An example from Germany ​

To illustrate what Netradar shows, we pulled data from the past couple of months from the three major players in Germany. Here are some examples of what we can notice immediately:​

• One of the providers has a lower minimum latency than the other two providers: a very significant difference- if I were a gamer, the choice of provider would be clear to me. ​

• One provider has much more latencies from congested data transfers that indicates a much higher load in the network and not enough capacity to serve the customers. I would potentially avoid this operator. ​

• One provider has a higher average latency, which indicates potential configuration sub optimality or even network issues. ​

• One provider has a very high average of the minimum latencies, calculated per data transfers – not a perfect partner for running delay sensitive applications.​

• The difference between optimal latency and latency in a congested network can become as high as 200ms for one provider, which will impact substantially mobile apps.​

• Looking at individual regions, Brandenburg has very high latencies from two network providers The same can be noticed in Saxony-Anhalt where two providers have high latencies without significant network load. The worst regional latency is found in Mecklenburg-Vorpommern where one provider offers up to 100% higher latencies than the two other providers. Avery significant impact on customer experience.​

• Looking at 5G, there is no difference in latency to 4G. This is due to the Non-Standalone Access (NSA) mode of deploying 5G, where the access network is the same for both 4G and 5G. In some cases, the 5G latency is even higher than 4G as people make use of the full bit rates and data transfer capabilities of the technology and load the network with traffic. Hopefully Standalone Access (SA) will change this, for both unloaded and congested networks.​

Conclusions

In summary, with the wide range of apps and services, and the emerging 5G networks, latency must be seen as an important metric besides bit rate. Measuring the real latency experienced by customers is critical as it sheds light on how the network is configured and how it performs with the daily apps and the data transfers. Finding these misconfigurations and network segments with a limited capacity will make a difference between an average network service and a great one. ​

Only Netradar can provide a full picture of the network performance as experienced by the end users. Book an introduction session and solution’s demo by contacting tomi.paatsila@netradar.com​

The Netradar Hybrid Measurement Technology

In the modern digital world, systems and services have become an intertwined and sensitive network where small changes or hick-ups in one corner can have dramatic effects on the system as a whole. Critical parts of the system need to be monitored for inconsistencies, and the performance and capacity need to evolve constantly to support the continuous growth.​

Mobile cellular networks are one critical component of the modern society. Mobile operators follow proactively the performance of their precious investment with various tools and services and react when things break. As mobile networks are built with simulations and planning tools but the end users are real, there is often a wide gap between the plans and the reality. Leading companies have invested in crowdsourcing to gather data from their real users, to support their processes and enhance their networks.​

In the context of mobile network measurements and in particular end-point measurements, we see two main types of measurements being used in crowdsourcing: active and passive. Active measurements are typically based on sending a synthetic payload to load the network and measuring the top speed of that transfer or sending latency measurement probes to calculate the latency. In passive measurements, the end point simply monitors the wireless interface and takes speed samples from the traffic flow.​

Active measurements can be triggered in a multitude of ways, e.g.,​

• By consumer wishing to test his current network top speed,​

• Remotely by a service provider to debug a potential network speed issue, or ​

• Periodically to gather intelligence on the network top speeds. ​

Regardless of the reason to trigger an active speed measurement, they still consume data, some more some less. The point is to see at that specific point in time, what would be the maximum speed the network could allow. The payload can be a synthetic data stream, the download of a certain set of web pages, or e.g. streaming some video with varying bit rates. The type of the payload affects the end result directly, e.g., if the payload is not able to saturate the link, we do not get to know the top speed of the network at all. In some tests, it might be enough to simply measure if the payload arrives within a certain delay bound, e.g., a web page loads all components in under 10 seconds.​

With synthetic speed tests, there are many challenges if one wants to have reliable results. The first is to decide how to saturate the link, using one or multiple data streams at the same time? Note that most consumer apps that do high speed transfers (buffer a video, update an app, download fresh content, etc.) use only one data stream.​

The next question is, how will you know that the link has been saturated and your results actually tell the network maximum speed? Typically speed test apps download and upload data for 10 seconds and expect that this time is enough to measure the link top performance. The downside is that the amount of data that is transmitted in a 10 second test can be huge, e.g., over a 4G network, it could be anything from 1MB (a user at the cell edge) to over 600MB (a user on an LTE-A network). This has a huge impact on the device power consumption and can use a huge fraction of the data plan if one is being used. Naturally running these types of tests periodically in the background does not make sense, as you never know beforehand how much data will be used.​

To counter the issue of potentially huge data consumption, many vendors use e.g. 5MB or 10MB files that are downloaded periodically in the background. The problem here is that with small data volumes, the high speed recorded might not tell of the network capability. On a slow network it should saturate the link, but on a fast network, it would not – and how do you know that from the speed metric?​

Moreover, the potential top speed of a mobile network can be anything from kilobits per second to even a gigabit per second – a difference of 1000X. How do you dimension your measurement servers and their network connection in such a way that they do not become the bottleneck themselves? If you get too much measurement traffic, you end up being limited by your measurement system, not by the network service being measured.​

Active methodologies are typically used in drive-by testing, where the amount of data consumed or battery consumption are somewhat irrelevant. In consumer-oriented crowdsourcing, the active methodologies suffer from the potentially huge data and energy consumption, which limits how much often they can be used. This results in very limited amounts of measurement data making the data less valuable. Mostly active measurements can be used for operator comparison benchmarks on a national level (going to more finer granularity is typically not possible with the small amount of data) or some reactive debugging following customer complaints. Active measurements can not be used to proactively monitor network quality on a finer level and seek to enhance the quality before customer complaints emerge.​

Furthermore, making an active measurement now at a given location does not tell what the performance was an hour ago or yesterday, or what it will be tomorrow. There is potentially some relationship, but it is not a reliable metric; you would need a lot of active measurements of the same location to increase your confidence.​

Passive methodologies can provide a considerable amount of measurement data as the purpose is to monitor ongoing consumer data transfers. The downside is that the monitored speeds do not include information about the reasons why a certain peak speed was recorded: was it the network maximum, was it the server maximum, or something else? So having a lot of speed records does not help much in the end.​

Latency measurements are also actively used to get information about how quickly the network can forward IP packets. Yet, as latency measurements are typically done outside actual data transfers, they record some sort of network ideal performance, but do not tell of the real latency experienced by the consumers’ data flows when they saturate the network entirely.​

Thus, in the mobile network context, the current purely active or passive measurement methodologies have some inherent downsides that make them rather limited in wider use. ​

Active and passive measurements have been the norm, and mobile operators are familiar with them. But are these the holy grail of end-point driven, crowd-sourced, network analytics, or could it be done differently?​

Hybrid measurements​

The IETF RFC 7799 states:​

“Hybrid Methods are Methods of Measurement that use a combination of Active Methods and Passive Methods, to assess Active Metrics, Passive Metrics, or new metrics derived from the a priori knowledge and observations of the stream of interest. ”​

Thus, in essence, we can think about combining active and passive methodologies to form something new. The Netradar hybrid is such an invention.​

The Netradar hybrid measurements combine passive and active techniques in a novel way. We use passive network monitoring to calculate the momentary bit rates. We augment these speed samples with an optimized stream of latency measurements probes. We do not create a synthetic payload, only measure latency.​

The Netradar hybrid measurements combine passive and active techniques in a novel way. We use passive network monitoring to calculate the momentary bit rates. We augment these speed samples with an optimized stream of latency measurements probes. We do not create a synthetic payload, only measure latency.​

As all crowd-sourced solutions measure speed and latency separately, we merge them together and run them at the same time. If the network is working well, the measured latency is stable or has a small jitter (horizontals and vertical handovers do create high latencies and jitter, but those are easy to spot and filter out). But once the network starts to receive too much load (downlink or uplink), it will have to start buffering the IP packets. When this happens, the latency starts to grow and jitter increases. The Netradar proprietary patent-pending algorithms detect this abnormal behavior and flag a passive measurement as having abnormal latency.​

This methodology has the benefit that we can acquire a huge amount of speed and contextual data on consumer’s real network speeds, and we know when the network had issues providing reliable and stable connectivity. Yet, we do not inject a huge synthetic measurement payload, only small ping packets. Our overhead on the end user device is roughly 0.1% of increased data consumption per month.​

To illustrate the power of hybrid measurements, let’s look at two maps. The data is from only one user to show how much data we can gather.​

First, we have speeds recorded in a suburb of Helsinki during February 2021. Note how many of the speeds are in the red, so less than 5Mbps. This is the data you would get from passive measurements. Based on this data, you would expect that this particular Elisa 4G network is pretty bad. Not quite so.​

Figure 1: All speed samples from passive data collection without any notion of why e.g. speeds are often under 5 Mbps (red is 5Mbps or lower peak speed​

When we filter out all the speeds where the network latencies were stable (by our definition and algorithms, considering a 4G cellular network), we are left with the locations that had irregular latencies while the consumers had data flowing to their favourite apps.​

Figure 2: Data speeds that were limited by the mobile network. Some are green, indicating a high speed and little impact to the user (if any), some are much lower impacting the user.​

If I were in the network quality department of this Finnish mobile operator, I would concentrate on the red dots in this latter map, look at the contextual data related to all dots, and what my network internal analytics have to say. Are these single incidents like a user at the cell edge, is there a load balancing or coverage issue where traffic is not balanced adequately, a misaligned antenna pointing in a bad direction, hardware issue, or something else?​

To illustrate further the power of our technology, consider the notion of latency. Network latency measurements are traditionally run outside data transfers. Netradar runs them inside the data transfers. While analyzing the latency probes and samples, we can calculate the minimum, average and maximum. And since we know if the jitter and latency behaved abnormally, we can also calculate the latency in a loaded and congested network, so the latencies consumers and their apps experience in real life if the network runs out of capacity.​

The figure below shows an example with real data. The figure shows the latency in a given area in February 2021. We have calculated altogether nine different latencies. The typical metric is the average latency (1). Yet, as the load in the network affects also the latency, we can distinguish between latency in an uncongested (lightly loaded) network (2) and the congested (highly loaded) network (3). These tell how the network really handles end user traffic and what is the latency when there is no shortage of capacity and when capacity has run out and end user traffic is constrained. In these cases, we can also calculate the minimum latencies and maximum latencies, adding a further 3+3 metrics (best and worst cases).​

Figure 3​

Now these latencies are much more valuable input to network planning and performance management. They tell about the real latencies happening, not the optimal case which looks good on reports to the management.​

To summarize, the power of the Netradar hybrid technology is the ability to analyze latency and latency variations during data transfers and draw conclusions on the performance of the mobile, or WIFI, network. The benefits over existing legacy methodologies are huge:​

1. Extremely small data and energy consumption as we do not inject synthetic payloads, only monitor the consumer’s data connection and measure latency.​

2. Detailed view of consumers’ daily mobile experience as our methodology is not based on random background speed tests but rather continuously monitoring the quality of the mobile network. ​

3. Data for proactively looking for network misconfigurations and problems before complaints occur. ​

4. No need for speed test servers so deployment is rather simple, we only need some very small ping servers and some place to push the collected metrics (your own database, Google Cloud, Amazon AWS or Microsoft Azure are all supported already)​

5. As the data collection is so extensive, even a small deployment, say, 5% of your customer base, will generate a huge amount of data. ​

Why mobile operators need to crowdsource their own data

Without massive speed and network performance data, operators cannot optimize customer experience or their investments.

Network statistics and drive-test data are how mobile operators measure the performance of their networks. Drive-tests especially are considered to be the best way to measure end-user mobile experience. And while it’s true that drive-testing enables very effective simulation of different services and detailed performance measurement, it’s still just that — a simulation. The only way to measure mobile user experience is to measure it on the point of consumption — the mobile device.

Current crowdsourcing vendors claim to provide just that. Mobile experience data collected from a large number of end-users, representing the real mobile experience. But despite this promise, crowdsourcing has remained a low-value tool for informing top management and giving marketing something to work with. Here’s why.

First, the data from user-initiated speed tests (like OOKLA’s SpeedTest) has a big measurement bias and a very low number of samples. Speed tests are run under a certain type of situations. Either the network is really good or bad, or the user has a new subscription and/or a phone. When compared to real maximum speeds end-users receive during normal usage, the results are very different.

And the data from background monitoring doesn’t deliver either. Companies like Tutela embed their technology into third-party apps and collect network performance data in the background. While this enables them to reach a lot of users, the sampling rates are typically very low and provide only a high-level view (country, city-level) of the performance. And these measurements are based on artificial traffic and not real usage.

As a result, the current crowdsourcing data is not used for network planning, optimization, or troubleshooting teams.

A great example of the confusion with current crowdsourcing is that in January 2021, different crowdsourcing companies announced AT&T (OOKLA), T-Mobile (OpenSignal) and Verizon (RootMetrics) as winners of some sort of “best” network in the US. So, is crowdsourcing doomed to remain just a marketing tool to make claims about being the best network when the results favour you? Luckily not.

1000x more speed data vs. traditional technologies

With next-generation crowdsourcing technology, also known as hybrid technology, operators can capture detailed and massive speed and performance data from real mobile usage. And by detailed we mean 1000x more speed data vs. traditional technologies. Hybrid technology is able to deliver massive speed and congestion data, by combining passive speed monitoring (delivers massive speed data) together with active latency measurements (used to detect when maximum speeds are reached).

By embedding this technology into their own applications (self-care and streaming apps) operators can easily collect performance data from 10–15% of their subscribers. This translates into millions of speed measurements every day.

Due to natural churn in their customer base, they can also collect significant competitor data as their apps will be running on devices with competitor subscriptions. In fact, more data they could buy from any crowdsourcing player.

This level of detail makes this type of crowdsourcing data actionable by technical teams. They can identify issues impacting real users, identify root causes, and improve. This is what crowdsourcing mobile network performance should look like: operators collecting performance data from their networks and using it to improve network performance — not to brag about it!

Role of 5G Post Pandemic — Winners will…

Year 2020 was extremely volatile for many industries including telecommunications. We at Netradar have been working with leading telecom operators, regulators, and technology providers to provide them solutions for capturing critical data on network performance as seen by the users to improve on the services based on the data collected. In this article we give some predictions about what trends will impact the telecommunications industry during the year of 2021 and how companies can emerge as a winner post pandemic.

1. Telecommunication industry will recover from the pandemic

The recent article by GSMA Intelligence suggested the mobile industry has suffered less financial impact due to Covid-19 than the broader economy, despite inevitable hits to revenue from roaming, handset upgrades and the enterprise sector. While the performance was worse than technology and internet groups (Facebook and Google) the mobile industry performed much better than retail, travel, and hospitality industries.

Pandemic has caused fundamental changes in user traffic patterns — both where and when the usage takes place. This has put tremendous pressure on telecom operators to understand how the usage patterns have changed and how to update connectivity solutions to match these changing needs.

Harvard Business Review article “Adapt Your Business to the New Reality” (Sep-Oct 2020) introduces a systematic approach for addressing these changes by categorizing trends into a matrix with two dimensions on temporary/structural and existing/new trends. According to HBR, 14% of the companies in the past four downturns have increased their financial performance by leveraging on these changes.

The fact is clear — there is a need for ubiquitous connectivity although usage patterns have changed. Netradar hybrid measurement technology enables telecom operators to take concrete and decisive actions resulting in more effective network planning and optimization, faster troubleshooting and better targeting of network investments.

2. 5G will hit the masses

According to GSMA Intelligence 30% of total data traffic in South Korea is being routed over 5G networks and the pace has nearly doubled within one year. Furthermore, Ericsson Mobility Report (Nov 2020) claims that by the end of 2020 over 1 billion people, or 15% of the world’s population, will live in 5G coverage areas and the number of 5G subscriptions at the end of the year is forecasted to be 220 million.

5G will provide the much-needed help in building network capacity but this obviously is largely dependent on the availability of mid-tier 5G devices and reasonably affordable operator 5G pricing plans.

At the technology front there will be a gradual update from 5G non-standalone networks (providing transition from existing 4G-LTE to 5G) to 5G standalone access networks. Most likely beneficiaries of 5G standalone access networks are selected industries leveraging advanced network-slicing functionality or use cases requiring ultra-low latency. Both versions of 5G are likely to co-exist for a long time.

Capturing 5G user performance data is critical for telecom operators to verify 5G speeds, to identify 4G congestion, to analyze in-building coverage and to optimize their 5G network. Legacy crowdsourcing technologies do not simply work well with (initially) low numbers of 5G users. However, Netradar samples 1000x more effectively than these legacy providers.

2. 5G will hit the masses

Recently we have seen operators in many markets launching flat rate data plans.

Change from volume-based data plans to flat rate-based plans will have fundamental implications. Obviously, the amount of cellular traffic will increase as consumers do not need any more to be that wary of their app usage or to consider offloading their cellular traffic to Wi-Fi networks. This will in turn require operators to be increasingly more cost efficient in building capacity solutions where they are needed.

Netradar provides our customers a solution which enables them to capture data how consumers’ usage patterns shift from Wi-Fi to cellular networks and how much of the user total data traffic goes through telecom operator own networks. All of this leading into actionable insights for improving the services as the usage patterns change.

4. Increasing reliance on multiple vendors

In December 2020, Nokia gave an update on its strategy and operating model stating the following: “Customers are using a best-of-breed approach to build these networks, selecting network elements from multiple individual vendors who are able to offer the best performance per total cost of ownership.” This is a fundamental shift from Nokia’s previous strategy of being a one-stop-shop for telecommunication providers.

Also, in December 2020, we saw a major outage of Google services for about an hour, sending many of its most popular services offline.

It is likely that consumers, corporations, regulators, and lawmakers will through their actions ensure that no single telecom vendor or technology company will take too dominant a position in the market.


Having said that, it is worth noting that the telecom market is regulated with multiple companies providing their services for consumers and corporations in a single market. Therefore, it is essential that telecom operators can measure how well they serve their customers with absolute terms and in relation to their competitors. Ericsson Consumer Lab report (2018) claims that consumers will pay on average 17% more if they perceive their telecom operator’s network performance to be the best in the market.


The obvious question if you are a telecom operator is:

“How can I emerge as a winner post pandemic?”

1. By focusing on your customer

Telecom operators need to understand from the customer’s point of view what are the fundamental changes in demand patterns before addressing them. They need to build a detailed heatmap with geolocated usage information highlighting potential customer experience issues.


Network based measurements give a rough estimate where the usage takes place but typically more accurate location needs to be captured to ensure that actions to improve connectivity are correct. Furthermore, as multiple connectivity methods (cellular, WiFi) are in use, the overall picture needs to cover all of these.


Collecting massive speed data is essential for targeting network investments and validating performance. Netradar enables telecom operators to capture 1000x more speed data than any other crowdsourcing technology with actionable insights not available from anybody else.


Capture 1000x more 4G / 5G speed data

2. By focusing on network usage and consumer experience

Maximum download speeds or signal strength alone do not explain a good or bad mobile experience. Instead, telecom operators must understand where and when user speeds are limited due to network congestion. Netradar’s unique network congestion detection pinpoints where and when network capacity constraints impact users by limiting their download/upload speeds.


Should a consumer only get 10Mbps throughput, telecoms operators need to identify if the network is congested or if the user is in a bad radio environment. Are cloud services at fault, or is it a particular mobile phone model, operating system — or even just a single device the limiting factor — or is the speed normal for this particular app?


Detect user-level congestion and root causes

3. By focusing on the actions to improve customer satisfaction

For many telecom operators, the scenario is very much known — raw data pours in from multiple sources and they are overwhelmed with limited resources to process all of this, let alone to produce actionable insights which drive improvements. Increasingly, telecoms operators are using AI based tools to identify network anomalies or angles where they can improve customer experience and satisfaction.


To start off, indoor performance is critical for telecom operators. The higher frequencies (4G and 5G) create challenges for radio network planning. Operators need detailed indoor performance data to improve. Netradar delivers massive performance data, mapped to 5-level of indoor zones depending on where the usage takes place — not available from any other provider. This enables operators to identify root causes and take the best corrective action.


Build a detailed view of indoor performance​


Should you want to understand how your network copes with these changes, get in touch with us to receive a complimentary analysis of your network or just a demo of the Netradar solution.


Learn more

Why your customers don’t care about download speed?

Network performance is a complex topic and like any complex topic, it’s always tempting to break network performance down into one or two simple measurements. For example, when trying to win customers, mobile network operators can sometimes fixate on technical metrics such as peak data rates, and 4G or 5G availability.


However, it’s easy to argue that most mobile customers are not that interested in technical specifications. All your customers want is a network that ensures that every app that they use gets the bandwidth it needs — when it needs it. In other words, customers want a network that never gets in the way of app performance.


That’s why a more nuanced approach to network performance matters so much. In this article we outline Netradar’s unique approach to network performance and how MNOs can use Netradar metrics to better focus network improvements.

Customer happiness is about more than peak bandwidth

Peak available bandwidth can indeed enable customer satisfaction. A bigger pipe fits more customer traffic and more customers through your network.


But network performance, and therefore app performance, is always the net effect of a range of factors — and theoretical peak bandwidth is just one factor. Factors that affect app performance include:


• Peak bandwidth. Maximum bandwidth under ideal conditions, as determined by the network technology that is deployed (e.g. 4G or 5G) and the backbone of the network.


• Distance from the base station. Clearly, the further away a user is from the base station the weaker the network signal — and the lower the bandwidth available to the user.


• Indoor users. Cellular signals lose data-carrying ability as soon as signals hit windows, walls and other barriers which will affect real-world bandwidth.

• Network load. Users share network resources, and network resources are finite — from base station bandwidth through to infrastructure bandwidth.


• App performance. Slow app responses and buffering media aren’t always due to network bottlenecks — it could be down to the cloud service that the app depends on.


With so many factors coming into play in the user experience it can be tempting to stick to basic network benchmarks and just hope that users are happy. After all, network operators can only rely on network metrics to troubleshoot.


MNOs do not really know when and where their customers are frustrated by poor in-app experience and once they leave it is simply too late to figure it out. Moreover, MVNOs do not typically have access even to the network metrics of the underlying network so even less understanding of the network performance.

Intelligent network satisfaction insights from Netradar

Compared to cold, hard network statistics that may not truly reflect the customer experience, Netradar’s unique capability to measure customer satisfaction right on the user’s device is a significant advantage that helps network operators optimise networks for maximum customer satisfaction.


Netradar’s measurement technology is unique in three aspects. First, we enable capturing detailed and massive network performance data directly on the user’s device. In other words, we provide MNOs with network performance numbers reflecting the user experience — not theoretical network metrics. And we provide data on a level of detail that can be acted on by technical teams.


Second, we are able to detect when and where the network is congested and limits user speeds. This is a completely new and unique insight and reveals where customer needs are not met.


Finally, we also have unique insight into app performance. In other words, irrespective of network performance, do apps work — or is something causing apps to fail or become unresponsive? As much as network measurements at a certain time may indicate an all-OK, the everyday app experience may be rather different.

A refined approach to performance metrics

Through years of device-based analytics Netradar has built up a solid understanding of the factors that cause glitchy in-app experiences. In other words, we can provide a more nuanced picture of where the real network problems lie.


Consider a broad-based metric where an operator selects a network speed target in order to make investment decisions. By merely evaluating target average download speed the MNO might end up with a map looking like this:

Figure 1: Download speeds as heat map, 10–20Mbps


The above map essentially indicates that much of the operator’s network barely meets the average download speed target. It makes it almost impossible to target network investment.


In contrast, Netradar can deliver a more relevant picture. For example, we can tell network operators when and where users commonly do not get the average download speeds that their apps require at any given time. This metric produces a much more nuanced map. The map below shows how well the network can offer 10 Mbps of download speed when the apps really need it.

Figure 2: Probability % for getting 10 Mbps of download speed (if the app needs it)


It makes it far clearer where users are really experiencing poor network performance in their day to day use of their mobile devices. Filtering the data, we can illustrate why it is far better to plan network tweaks around the real user experience instead of an arbitrary numbers-based goal.

Figure 3: Location with the lowest probability of getting 10 Mbps (or higher) download speeds

What can MNOs do to improve the user experience?

Operators could always choose the brute force approach: simply investing in significantly more network infrastructure to deliver wide, open data pipes that never put the user experience at risk.


But doing so is not really an option — cellular services are a competitive sector. Excessive investment expenditure will bubble up to plan pricing, which could turn users away.


The detailed data collected with Netradar help MNOs to make more considered, more careful decisions and save on expenditure to build excessive network capacity.


For example, the planning and optimization personnel can zoom into the map above and drill down to see exactly where user needs are not being met:


Because Netradar pinpoints the location of users with poor in-app experiences so clearly, network operators can easily tweak their network to improve the experience for users who are close to the edge of churning. Some steps operators may take include:


• Load balancing. Users are often served by multiple base stations. Taking a more considered approach to the balancing of load across base stations can ensure that sufficient bandwidth is available to every user, no matter which base station they are connected to.


• Adding frequencies. Changing the hardware on a base station can also break capacity barriers by simply introducing a larger volume of available capacity to the network, without the exorbitant expense of adding base stations.


• Tweaking antennas. Again, with a reference to the physical location of users, MNOs can consider tweaking the direction in which antennas point to better accommodate a broader range of users. Merely changing antenna direction can also account for changing environmental factors — and user demand that grows unexpectedly.


Netradar enables MNOs to capture detailed, specific data required to tweak and tune network parameters so that network performance does not frustrate customers.

Due to natural churn in their customer base, they can also collect significant competitor data as their apps will be running on devices with competitor subscriptions. In fact, more data they could buy from any crowdsourcing player.

Focus on the experience — not the metrics

In summary, Netradar’s unique approach to performance metrics emphasizes service levels — and the user experience. It is a much better basis for network tweaking and investment decisions compared to broad-brush metrics such as peak available bandwidth.


To find out more about Netradar’s novel approach to service level metrics simply get in touch with the Netradar team here.

Identifying Network Performance Gaps Using Customer Data

Network performance gaps, whether in coverage, capacity, or indoor reach are never a positive. Customers pay for a predictable service, and performance gaps will leave your customers disappointed — leading to churn.


For mobile network operators (MNOs) identifying, prioritising and addressing network performance gaps is critical to customer retention. However, internal network metrics can provide a skewed picture: network-based perspectives are not always the same as faced by the customers of telecom operators.


Besides, internal metrics are not always instantly actionable. The Netradar Suite delivers an independent, actionable data set that highlights network anomalies in a way that’s actionable — and easy to prioritise. Let us take a look.

Netradar data detects three critical network anomalies

With Netradar Suite network operators have the opportunity to identify poorly performing areas of their network in three key areas:


• Capacity problems. In other words, do users regularly experience network congestion in a specific location? What data transfer speeds do users typically experience in that area? If user faces congestion — is this due to the cellular network or due to used app?


• Signal quality issues. A poor network experience can also be due to bad signal quality –influenced by the location of base stations and nearby buildings. Netradar flags areas where RSRP/RSRQ measurements are poor.


• Indoor reception. Users expect good service everywhere — including indoors. The Netradar Suite highlights locations where users are commonly experiencing poor network service indoors and distinguishes indoor coverage issues from broader coverage problems.


Viewed in combination, these three metrics give MNOs insight into the real user experience from different angles. Three different metrics also provide the ability to triangulate when trying to diagnose a network problem, whereas a single metric can be less helpful when it comes to diagnosing issues.

Measurements that reflect the user experience

The data measured by the Netradar Suite has a key advantage over network statistics: data is collected directly on the user’s device and real usage is measured. In other words, anomalies detected by the Netradar Suite directly reflect the experience of real users as they use their device throughout the day.


It is an important distinction. Operator metrics are to a large degree based on readings taken on base stations. These readings do not fully reflect the physical location of the user. It does not tell the operator whether a user is suffering from poor performance due to an awkward indoor location, or while they are located outdoors.

The Anomaly Detector dashboard

All of the above factors can readily be evaluated in a number of convenient ways. First, Netradar Suite presents a visual, colour-coded map that highlights areas of poor performance. This map can be overlaid across satellite imaging so that operators can identify whether performance gaps are occurring in the middle of a forest — or across a densely packed urban area.

Operators can also choose to view anomalies by a specific geographic area — evaluating performance in a target city, for example.


Importantly, Netradar Suite also gives MNOs the ability to rank poorly performing areas in an actionable list. Operators can specify a minimum performance hurdle and immediately receive actionable data that highlights the locations where performance drops below a minimally acceptable level.


The Netradar Suite intuitively presents information in a way that makes it easy for network operators to rapidly identify problem areas. Netradar does not simply display data: we pro-actively organise data so that it is easy for MNOs to identify problem areas.


It’s a uniquely powerful tool: in areas targeted for investment, MNOs can set the sensitivity for poor performance to a very high standard. In other areas, operators can use the Netradar Suite to identify only the areas most likely to lead to customer complaints.

Comparing internal projections with the real world

MNOs are, of course, not making investment decisions blindfolded. Existing network metrics and models are capable — but, as we suggested, network-based models are imperfect and inevitably based on assumptions.


There is another important factor: the real world is dynamic. New construction goes up, equipment undergoes wear-and-tear and the natural environment changes. Network based models are unlikely to keep up with these changes — the manpower required to continuously survey the operating environment is simply too high.


It becomes a particularly significant problem when looking at indoor coverage. However, Netradar’s indoor detector has a unique approach to measuring indoor performance — looking at a range of data points to establish whether poor service is tied to a lack of indoor coverage.


Netradar’s unique user-derived network data gives network operators a critical opportunity to sanity-check network-based modelling. In other words, does the real-life network experience reflect network-based metrics and estimates?

Actionable data that helps operators to accurately prioritise investments

Building and improving mobile networks is an expensive exercise. Investment must be balanced against the cost presented to users, so operators understandably prioritise network investment. However, deciding where to invest first is not easy. The race to roll out 5G in the most effective way compounds existing problems — particularly given 5G’s unique indoor coverage characteristics.

MNOs will, of course, do network-based modelling to determine the optimal investment strategy. However, the assumptions and models used will never sketch a perfectly accurate picture of real-world usage. Netradar Suite adds an important additional layer of data that is highly actionable.


Combining network-based metrics and models with Netradar’s user-derived data source gives MNOs the perfect marriage between theoretical, network-derived network planning data, and the real experiences of users on the ground.


For 5G rollouts Netradar adds another invaluable, unique angle by providing critical insight into the indoor coverage experience. Get in touch with us to see how Netradar unique user-driven viewpoint can inform your operational decision making — to achieve better investment outcomes and happier users.